The secret to maintaining reliable, high-quality service in different digital TV transmission systems is to pay attention to those key factors that may undermine the integrity of the system. This article describes these key RF measurements that can help detect problems before viewers lose their digital TV service and picture entirely.
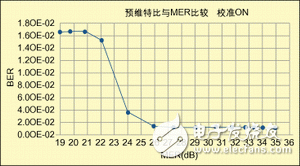
Figure 1: Has
Modern digital cable, satellite and terrestrial systems are very different from traditional analog television in that their signals are susceptible to noise, distortion and interference in the wiring. Consumers today are accustomed to viewing analog television with ease. If the picture quality gets worse, people usually adjust the indoor antenna to get a better picture. Even if the picture quality is still poor, if the program is attractive enough, viewers will generally continue to watch it as long as the sound is still audible.
Digital TV is not so simple. Once an interruption has been received, the way to recover is not always obvious. The problem could be caused by MPEG SI or PSIP table errors, or simply because the RF power is too low to reach the digital operating threshold or “spike” point. RF problems may include any of the following: satellite dish or low noise block switch (LNB) problems, terrestrial RF signal reflections, poor noise performance or channel interference, in addition to cable amplifier or modulator failures.
There are several ways to solve digital TV reception problems. One solution is to reduce the sensitivity of set-top box receivers to signal quality, and the more fundamental solution is that operators should maintain clean and high-quality radio frequency signals. To ensure this, Tektronix offers key RF measurement capabilities, integrating real-time MPEG monitoring and recording in a single MTM400 instrument. These instruments can be economically deployed at various points throughout the transmission chain from downlink and decoding, to multiplexing and remultiplexing, and finally to program distribution through uplink, headend and transmitter stations. With the MTM400, operators can make critical RF measurements at a fraction of the cost of dedicated RF test equipment. The web-based remote control allows correct measurements to be made at the appropriate signal layer in the transmission chain, ensuring cost-effective results.
bit error rate BER
The bit error rate is the ratio of the number of bits in error to the total number of bits transmitted. Early digital television monitoring receivers provided a bit error rate indication as the only measure of digital signal quality. This is easy to do because the data is usually provided by the tuner demodulator chipset and is easy to process. However, tuners may often output BER after performing forward error correction (FEC). A better way is to measure BER before FEC, which can give an indication of how well FEC is doing. After the Viterbi de-interleaving process, Reed-Solomon (RS) decoding corrects the erroneous bits to give a quasi-error-free signal at the output.
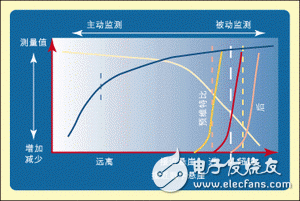
Figure 2: MER and
This approach works when the transmission system is operating away from spikes, when few data errors occur, and the bit error rate prior to Viterbi is close to zero. When the system approaches the peak, the BER before Viterbi gradually increases, the BER after Viterbi increases rapidly, and the BER after FEC (after RS) increases sharply. Therefore, FEC has the effect of sharpening the peak angle. As a result, very sensitive bit error rate measurements can give an alert, but it is usually too late for any corrective action to be taken. Still, it is useful to display the BER to document or quantify the quality of the transmitted signal. BER can also be used to record long-term system trends. It is best used to identify periodic short-duration signal defects.
BER measurements are often used in engineering notation and are often displayed as an instantaneous ratio and an average ratio. Typical target value is 1E-09, quasi-error-free BER is 2E-04; critical BER is 1E-03; BER greater than 1E-03 will lose service.
How to improve BER—using MER
The TR 101 290 standard introduces measurement criteria for digital television systems. The Modulation Error Ratio (MER) measurement is designed to provide a single figure of merit for the received signal. MER provides an early indication of a receiver’s ability to correctly decode the transmitted signal. In effect, MER compares the actual position of a received symbol (representing a digital value in a modulation pattern) with its ideal position. As the signal quality degrades, the received symbols are farther from the ideal position, and the MER measurement will decrease.
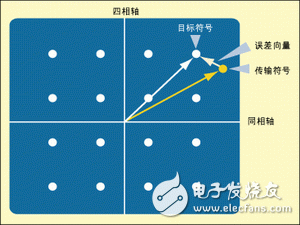
Figure 3: Error vector.
As the signal quality continues to degrade, symbols will eventually be decoded incorrectly and the bit error rate will increase, reaching a threshold or spike point. The graph shown in Figure 1 was obtained by connecting the MER receiver to a test modulator. After the connections are made, gradually introduce noise and record the MER and BER values before Viterbi. When there is no additive noise, the initial value of MER is 35dB, and BER is close to zero at this moment. It is worth noting that as the noise increases, the MER gradually decreases, while the BER remains unchanged. When MER reaches 26dB, BER begins to increase, showing that it is close to the peak point. MER shows that the signal quality of the system is degrading long before the peak point is reached.
Importance of MERs
Since Tektronix’s equipment can measure a very high limit MER value (a typical value of 39dB in a QAM system), when the MER reduction factor (safety margin) of the downstream signal flow is known or can be performed at or near the user When measured, monitoring equipment located at the front-end modulator can provide an early indication of signal degradation. When the MER drops to 24dB (for 64-QAM) or 30dB (for 256-QAM), ordinary set-top boxes may not be able to demodulate correctly or fail to work. Other common measurement equipment with lower limit MER measurement capabilities will not be able to give early warning of signal degradation. The typical limit MER of the cable (QAM) front end is 35-37dB. The MER in analog cable systems is typically 45dB. The data in the analog and digital systems differ by 10dB, so the digital MER in the transmission system is about 35dB.
Error Vector Magnitude EVM
The EVM measurement is similar to MER, but expressed differently. EVM is expressed as a percentage value of the RMS error vector magnitude to the maximum symbol magnitude. As signal defects increase, EVM will increase and MER will decrease. MER and EVM can be converted to each other. EVM is the distance between the detected carrier on the IQ (in-phase and quadrature) constellation and its theoretically accurate position (see Figure 3), and is the ratio of the “error signal vector” to the “maximum signal amplitude”, expressed as RMS percentage value. EVM is defined in an annex to TR 101 290. Tektronix MTM400 provides both MER and EVM measurement capabilities.
Variations of modulation schemes and systems
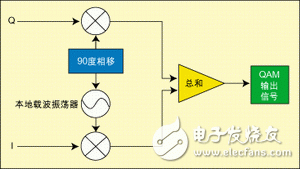
Figure 4: QAM modulator.
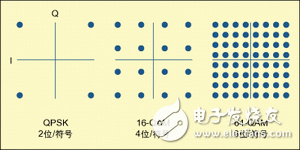
Signals in satellite, cable, and terrestrial digital television transmission systems use quadrature modulation schemes, which represent data symbols by modulating phase and amplitude. The most common modulation schemes used in digital television transmission are variations of quadrature amplitude modulation (QAM). For example, in the commonly used terrestrial digital modulation scheme, COFDM adopts 16-QAM or 64-QAM, and 8VSB adopts an 8-column system. The digital modulation scheme used in the satellite digital TV system is QPSK (Quadrature Phase Shift Keying), which is equivalent to 4-QAM. QPSK is a very robust modulation scheme and has been used for many years. QPSK also uses the available bandwidth more efficiently, but requires a higher carrier-to-noise ratio.
Cable digital television systems build on this foundation with a wider variety of modulation schemes and are still evolving. Other modulation orders (16-QAM, 64-QAM, 256-QAM, and 1024-QAM) increase spectral efficiency, thereby providing more channels in a given bandwidth.
In the digital TV system of the United States, the transmission rate of 64-QAM can reach 27Mb/s, which is equivalent to transmitting 6-10 SD channels or 1 HD channel in a 6MHz bandwidth. New compression technology can provide up to 3 HD channels on 256-QAM. In the European system, 8MHz bandwidth can obtain the transmission rate of 56Mb/s on QAM-256.
In addition to measuring QPSK for satellite applications, the MTM400 is capable of RF interfacing and measuring with all of the above QAM standards.
constellation display
The constellation display is the digital equivalent of the vectorscope display, showing the in-phase (I) and quadrature (Q) components of a QAM signal. A symbol is the smallest component of information transmitted in a particular modulation system. For QAM-64, one symbol represents 6 bits and is drawn as a point on the graph. These sign bits go through a complex transcoding process from the original MPEG-2 transport stream. This process includes Reed-Solomon coding, interleaving, randomization, QAM Annex B system trellis and QPSK system convolutional (Viterbi) coding. Its purpose is to protect and correct bit errors, provide immunity to burst noise, and distribute energy evenly in the frequency spectrum. After reversing this process in the decoder, the quasi-error-free bitstream must be reconstructed. Because of this error correction process, simply inspecting the transport stream will not give any indication that the channel or modulators and processing amplifiers are introducing errors, bringing the system closer to a “digital spike.” By the time Transport Error Flags (TEFs) start being reported in the MPEG stream, it is usually too late to take any corrective action.
Constellation
The constellation diagram can be regarded as a “two-dimensional eye diagram” array of digital signals, and the position of symbols in the diagram has reasonable restrictions or decision boundaries. The closer together the points representing received symbols are on the graph, the higher the signal quality. Since the graph on the screen corresponds to magnitude and phase, the shape of the array can be used to analyze and determine many defects and distortions of the system or channel, and help to find their causes.
Constellation diagrams are useful for identifying modulation problems such as:
- Amplitude imbalance
- Quadrature error
- Correlated Interference* Phase Noise, Amplitude Noise
- Phase error
- Modulation error ratio Remote
- Constellation
- MTM400 uses web-based technology, so it is unique in that it can view the constellation map for an unattended test and exploration location through the Internet or private network in different places or even different countries. The user interface also has adjustable persistence to fade out speckle in earlier receive carriers, just like on conventional instruments. Note: The following MTM400 screen graphics are all from the instrument whose display effects of MER and EVM are similar through test settings, only the display of the constellation diagram is different.
- quadrature error
- Quadrature error causes symbols to be positioned closer to the boundary limits in the plot, thus reducing the noise margin. When the difference between I and Q is not accurate to 90 degrees, quadrature error will appear. The result is that the constellation diagram is no longer a square, but looks like a parallelogram or a rhombus. Noise Error
- Figure 6: Constellation Basics.
- Noise is the most common and unavoidable impairment in any signal, including QAM. Additive white Gaussian noise (AWGN) is a general type of noise impairment. Because it is white (flat power density function over frequency) and Gaussian in nature (mathematically “normal” amplitude density), the received symbols are distributed around ideal locations.
- gain compression
- The MTM400’s graphical signal display enables the operator to observe the I- and Q-axis gain compression that results in rounded corner edges, but only when the modulator or fiber optic transmission system is reaching its limits. At this time, the signal amplitude is high,
- showing nonlinearity.
- When gain compression occurs, the graph appears to be “hemispherical” or “fisheye”. related interference When correlated interference occurs, the channel interference or harmonic content is precisely phase-locked to the IQ signal. At this point, the graphic display is a set of donuts, or “donut” shapes.
- Phase noise (I, Q jitter)
- Any carrier source or local oscillator in the signal chain will generate phase noise or phase jitter that is superimposed on the received signal. Phase noise is shown as concentric arcs of the carrier symbols.
- acceptable signal
- In modern all-digital modulators, IQ gain and phase errors are usually negligible. These errors occur not because of misalignment, but because of equipment failure. On the other hand, compression may also occur in modulators, upstream converters and transmission networks.
- Summary of this article
- It is better to anticipate system problems before digital TV service fails, rather than wait until problems arise and try to fix them. MER measures small changes in transmitter and system performance and is one of the best quality factors in any cable and satellite transmission system. EVM and more traditional BER are useful for standard cross-device inspections and to help identify short-term signal degradation. Constellation diagrams can indicate imperfections, distortions, or device deviations and can help provide a reliable “sanity check” for RF transmission systems. By combining these critical RF measurements with comprehensive MPEG Transport Stream monitoring and alerting capabilities in a single detector, DTV operators can detect system problems at an early stage before they impact viewer viewing. With the MTM400, Tektronix is now able to provide all key RF measurements and interfaces, and integrate MPEG measurements in a single cost-effective monitoring probe.
