

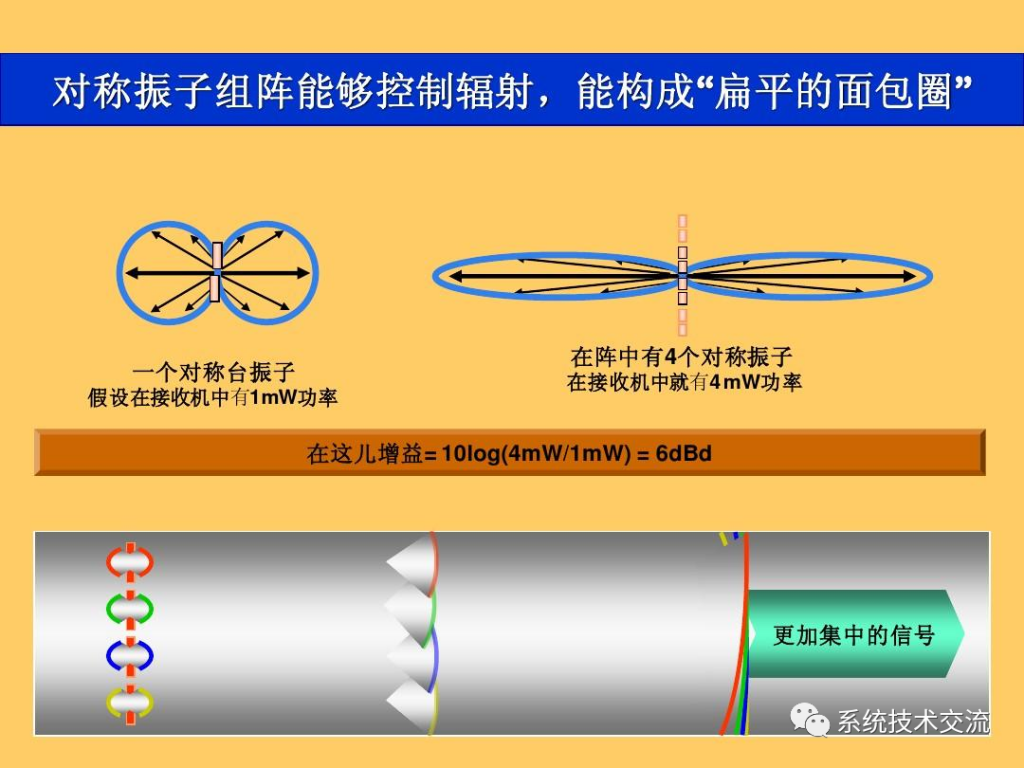
Due to the special design of the antenna, the radiation density can be concentrated in a certain spatial direction. The measure of lossless antenna directivity is antenna gain. It is closely related to the directivity of the antenna. In contrast to directivity, which only describes the directional characteristics of an antenna, antenna gain also takes into account the efficiency of the antenna.
radiation
Therefore, it represents the actual radiated power. This is usually less than the power provided by the transmitter. However, because this power is easier to measure than directivity, antenna gain is more commonly used than directivity. Under the assumption of considering a lossless antenna, the directivity can be set equal to the antenna gain.
radiation
The reference antenna is used to define the antenna gain. In most cases, the reference antenna is a lossless assumed omnidirectional radiator (isotropic radiator or antenna) that radiates uniformly in all directions, or a simple dipole antenna, at least in the plane considered refer to.
radiation
For the antenna to be measured, the radiation density (power per unit area) is determined at a point at a certain distance and compared with the value obtained using a reference antenna. Antenna gain is the ratio of two radiation densities.
radiation
For example, if a directional antenna produces 200 times the radiation density than an isotropic antenna in a certain spatial direction, the value of the antenna gain G is 200 or 23 dB.
radiation
Antenna Pattern
An antenna pattern is a graphical representation of the spatial distribution of energy radiated by an antenna. Depending on the application, the antenna should receive only from a certain direction but not signals from other directions (e.g. TV antenna, radar antenna), on the other hand a car antenna should be able to receive transmitters from all possible directions.
radiation
An antenna radiation pattern is a graphical representation of the elements of an antenna’s radiation characteristics. An antenna pattern is usually a graphical representation of the directional characteristics of an antenna. It represents the relative intensity of energy radiation or the quantity of electric or magnetic field strength as a function of antenna direction. Antenna diagrams are measured or generated by simulation programs on a computer, for example, to graphically display the directivity of a radar antenna and thereby estimate its performance.
radiation
Compared to omnidirectional antennas, which radiate evenly in all directions of the aircraft, directional antennas favor one direction and therefore achieve a longer range in this direction with lower transmission power. Antenna radiation patterns graphically illustrate the preferences determined by measurements. Due to reciprocity, identical transmitting and receiving characteristics of the antenna are guaranteed. The diagram shows the directional distribution of the transmission power as field strength and the sensitivity of the antenna during reception.
radiation
The required directivity is achieved through the targeted mechanical and electrical construction of the antenna. Directivity indicates how well an antenna receives or transmits in a certain direction. It is represented in a graphical representation (antenna pattern) as a function of azimuth (horizontal plot) and elevation (vertical plot).
radiation
Use Cartesian or polar coordinate systems. Measurements in graphical representations can have linear or logarithmic values.
radiation
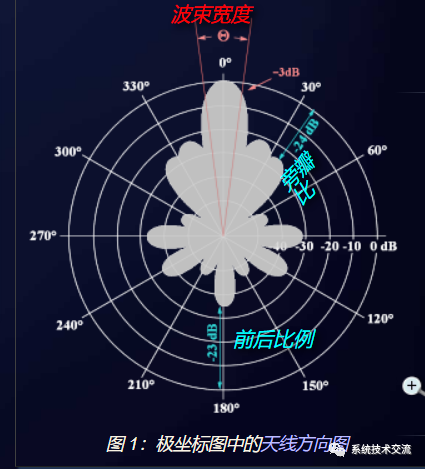
Use many display formats. Cartesian coordinate systems, as well as polar coordinate systems, are very common. The main goal is to show a representative radiation pattern horizontally (azimuth) for a full 360° representation or vertically (elevation) mostly only for 90 or 180 degrees. The data from the antenna can be better represented in Cartesian coordinates. Since these data can also be printed into tables, the more descriptive trajectory curve representation in polar coordinates is usually preferred. In contrast to the Cartesian coordinate system, this directly indicates the direction.
radiation
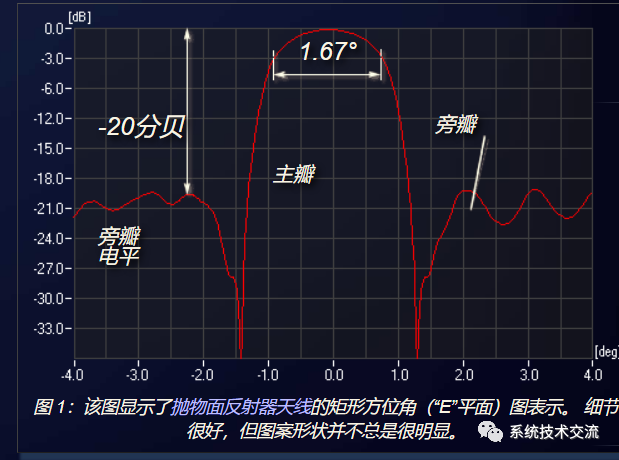
For ease of manipulation, transparency, and maximum versatility, radiation patterns are usually normalized to the outer edges of the coordinate system. This means that the maximum value measured is aligned with 0° and plotted on the upper edge of the chart. Further measurements of the radiation pattern are usually shown in dB (decibels) relative to this maximum value.
radiation
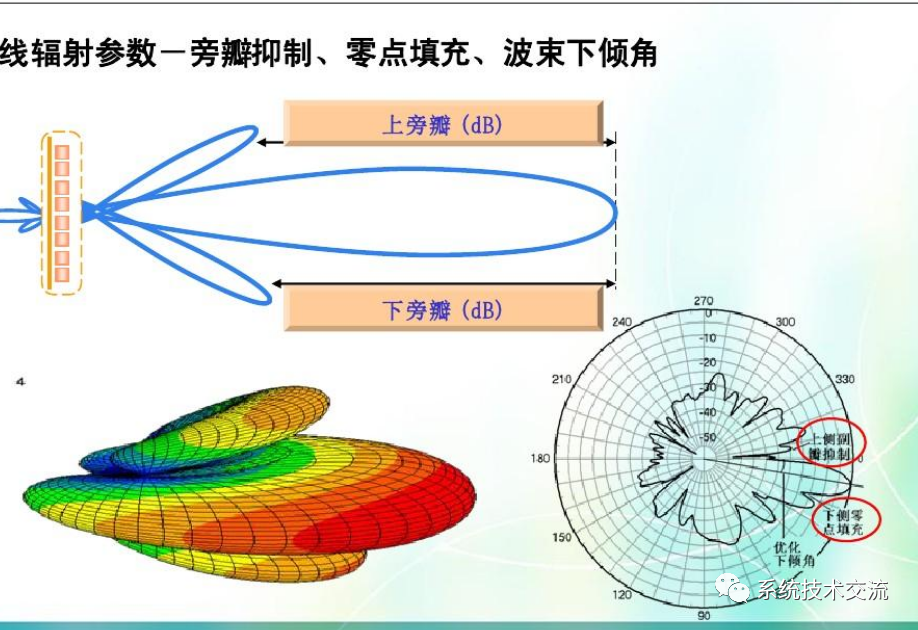
The scale in the figure can vary. There are three types of commonly used plotting scales; linear, linear logarithmic and modified logarithmic. The linear scale emphasizes the main radiation beam and usually suppresses all side lobes since they are usually less than one percent of the main lobe. However, the linear-log scale represents the side lobes well and is preferred when the levels of all side lobes are important. However, it gives the impression of a bad antenna because the main lobe is relatively small. The modified logarithmic scale (Figure 4) emphasizes the shape of the main beam when compressing the very low-level (<30 dB) sidelobes toward the center of the mode. Therefore, the main lobe is twice as large as the strongest side lobe, which is advantageous for visual presentation. However, this form of representation is rarely used in technology because it is difficult to read accurate data from it.
radiation
radiation
horizontal radiation pattern
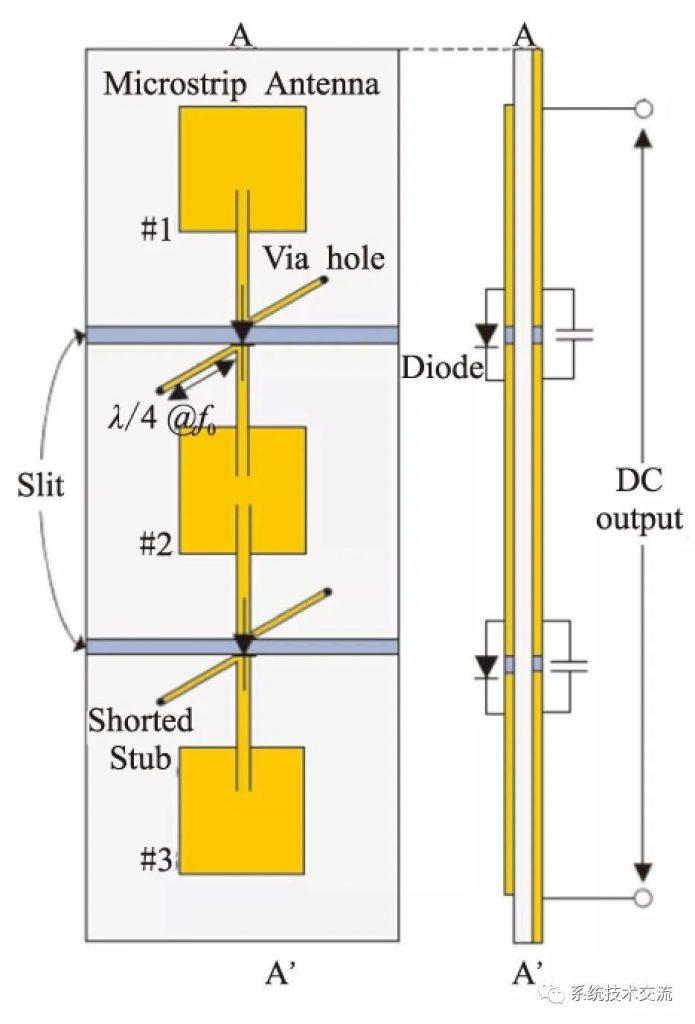
The horizontal antenna diagram is a plan view of the electromagnetic field of the antenna, expressed as a two-dimensional plane centered on the antenna.
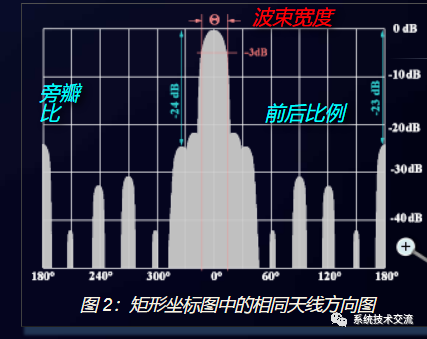
The interest of this representation is to simply obtain the directivity of the antenna. Typically, the value -3 dB is also given as a dashed circle on the scale. The intersection between the main lobe and this circle results in the so-called half-power beamwidth of the antenna. Other easy-to-read parameters are the advance/retreat ratio, that is, the ratio between the main lobe and the trailing lobe, and the size and direction of the side lobes.
radiation
radiation
For radar antennas, the ratio between main lobe and side lobe is important. This parameter directly affects the evaluation of radar anti-interference degree.
radiation
vertical radiation pattern
The shape of a vertical pattern is a vertical crosscut of a three-dimensional figure. In the polar plot shown (a quarter of a circle), the antenna position is the origin, the X-axis is the radar range, and the Y-axis is the target height. One of the antenna measurement techniques is solar stroboscopic recording using the measurement tool RASS-S from Intersoft Electronics. The RASS-S (Radar Analysis Support System for Sites) is a radar manufacturer-independent system for evaluating different elements of a radar by connecting to already available signals, under operating conditions.
radiation
Figure 3: Vertical antenna pattern with cosecant square characteristic
In Figure 3, the units of measurement are nautical miles for range and feet for altitude. For historical reasons, these two units of measurement are still used in air traffic management. These units are of secondary significance simply because the quantities of radiation plotted are defined as relative levels. This means that the boresight has acquired the value of the (theoretical) maximum range calculated with the help of the radar equation.
radiation
The shape of the graph provides only the required information! To get the absolute value you need a second plot measured under the same conditions. You can compare the two graphs and realize excessive increases or decreases in antenna performance.
radiation
Radials are markers for elevation angles, here in half-degree steps. Unequal scaling of the x- and y-axes (many feet versus many nautical miles) results in nonlinear spacing between elevation markers. The height is displayed as a linear grid pattern. The second (dashed) grid is oriented on the curvature of the Earth.
radiation
Three-dimensional representations of antenna diagrams are mostly computer-generated images. Most of the time they are generated by simulation programs and their values are surprisingly close to the actual measured plots. Generating a true measurement map means a huge measurement effort, since each pixel of the image represents its own measurement value.
radiation
A three-dimensional representation of the antenna pattern in Cartesian coordinates from a radar antenna on a motor vehicle.
(Power is given in absolute levels! Therefore, most antenna measurement programs choose a compromise for this representation. Only the vertical and horizontal parts of the diagram through the antenna can be used as actual measurements.
radiation
All other pixels are calculated by multiplying the entire measurement curve of the vertical plot by the single measurement of the horizontal plot. The computing power required is enormous. Apart from a pleasing representation in presentations, its benefit is questionable, since no new information can be obtained from this representation compared to two separate plots (horizontal and vertical antenna plots). On the contrary: especially in peripheral areas, the graphs generated with this compromise should deviate significantly from reality.
radiation
Additionally, 3D plots can be represented in Cartesian and polar coordinates.
radiation
The beamwidth of a radar antenna is usually understood as the half-power beamwidth. The peak radiated intensity is found in a series of measurements (mainly in an anechoic chamber) and then the points located on either side of the peak, which represent the peak intensity raised to the half power. The angular distance between half-power points is defined as the beamwidth. [1] Half power in decibels is −3 dB, so half power beamw


