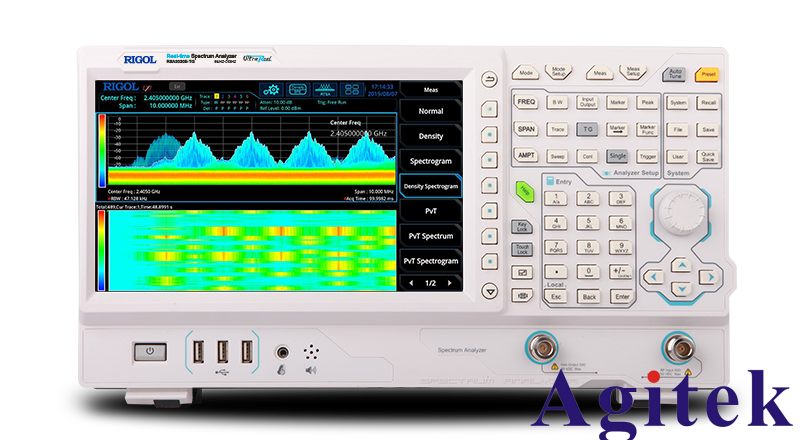
There are a variety of analytical instruments on the market, which can be easily identified for veterans, but many novice design engineers cannot tell them apart. Such as the measurement of communication transmitters and interference signals, spectrum monitoring, device characteristic analysis, etc., all walks of life and departments have different focuses on the application of spectrum analyzers.
How to choose a spectrum analyzer is essential for signal analysis. So what is a spectrum oscilloscope? Where can it be applied?
Next, the editor of Xi’an Antai Test will introduce it to you.
What is a spectrum analyzer?
A spectrum analyzer is a commonly used test instrument in RF and microwave applications. It is used to measure signal parameters such as signal distortion, system adjustment, spectral purity, frequency stability, and cross-adjustment distortion. It can be used to measure certain parameters of circuit systems such as amplifiers and filters, and is a multipurpose electronic measuring instrument. Also known as a frequency domain oscilloscope, tracking oscilloscope, analytical oscilloscope, harmonic analyzer, frequency characteristic analyzer, or Fourier analyzer.
There are six key devices of the spectrum analyzer:
Input attenuator
The input attenuator is the first stage of signal processing in the spectrum analyzer. The input attenuator function of the spectrum analyzer includes the following aspects:
Ensure that the spectrum analyzer maintains good matching characteristics in a wide frequency range;
Protect frequency mixing and other intermediate frequency processing circuits. Prevents component damage and excessive non-linear distortion.
Mixer
The mixer completes the spectrum shift of the signal, and converts the input signals of different frequencies to the corresponding frequencies.
IF filter
The intermediate frequency filter is a key component in the spectrum analyzer. The spectrum analyzer mainly relies on the filter to distinguish different frequency signals. Many key indicators of the spectrum analyzer (measurement resolution, measurement sensitivity, measurement speed, measurement accuracy, etc.) are related to the IF filter. The bandwidth and shape are related.
Logarithmic amplifier
A logarithmic amplifier refers to an amplifying circuit in which the output signal amplitude has a logarithmic function relationship with the input signal amplitude. Mainly converting a signal to its logarithmic equivalent involves a non-linear operational amplifier.
Geophone
A detector is a device that detects some useful information in a fluctuating signal. A device used to recognize the presence or change of waves, oscillations, or signals. Geophones are usually used to extract the carried information.
Video filter
The video filter performs low-pass filtering on the output video signal of the detector, and reducing the video bandwidth can smooth the noise and jitter in the spectrum display, thereby reducing the jitter range of the display noise
Spectrum oscilloscope application scope
The spectrum analyzer can analyze the frequency distribution information, frequency, power, harmonics, clutter, noise, interference and distortion of the signal.
Spectrum analyzers are essentially highly specialized receivers that can be adjusted in different configurations, so they have a wide range of applications and can be used to detect and measure continuous wave (CW) and modulated RF/microwave signals. Through the test of the spectrum analyzer, many important performance parameters can be obtained, such as signal frequency, signal power, signal bandwidth, spurious and so on. Proper use of a spectrum analyzer to test and analyze signals is also an important skill for an RF engineer.
Typically, a spectrum analyzer’s sensing hardware and related features are combined with software and control systems to enable more powerful signal information collection and measurement. For example, FSL spectrum analyzers can be used to measure dynamic range, peak power, average power, peak-to-average power ratio (PAPR), and other performance measurements required in characterizing RF devices.

FSL Spectrum Analyzer
When users use a spectrum analyzer, the most common and familiar interface is the standard frequency and signal power curve. Some spectrum analyzers can also plot the frequency and signal power over a period of time, called a spectrogram, which is very useful for analyzing the characteristics of a transient signal during that time period. Other common spectrum analyzer interfaces include modulation/demodulation plots, some of which display IQ data directly from the input signal.

